
We are analysts
We provide spatial analysis technologies for a variety of business users. Our analytical technology offerings include applications for GIS, advanced spatial analysis, visualization, reporting and data dashboards.

We provide spatial analysis technologies for a variety of business users. Our analytical technology offerings include applications for GIS, advanced spatial analysis, visualization, reporting and data dashboards.
We carry out thematic cartography specialized in maps of specific themes for retail trade.

We determine the coordinates of objects on Earth (longitude, latitude, altitude).
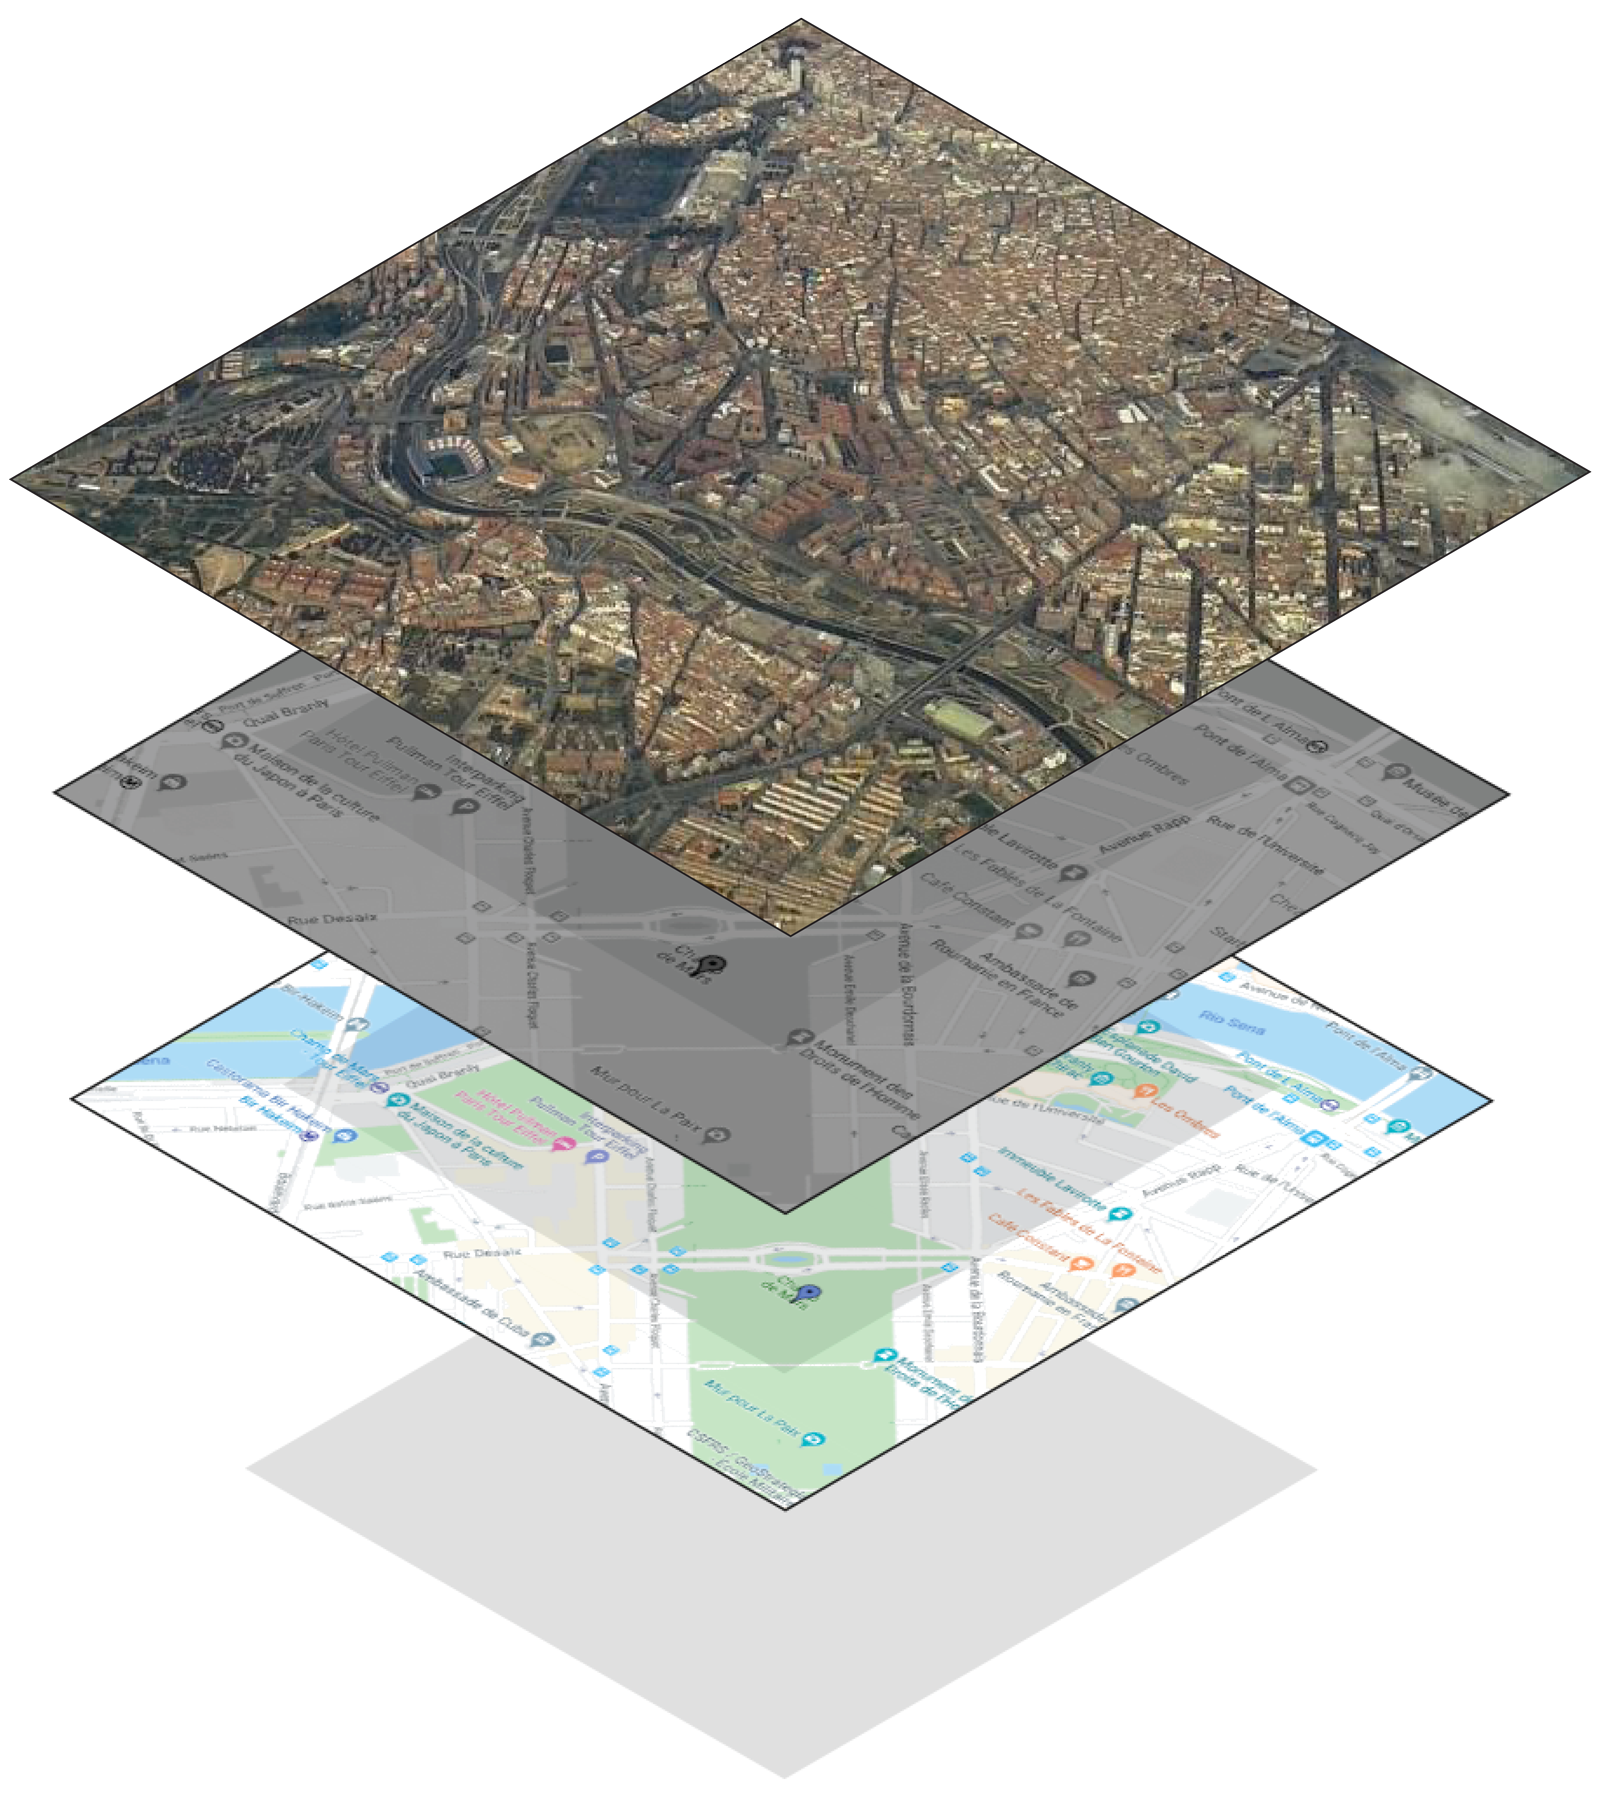

We have a social and demographic database at the portal level.

We find the geographic coordinates and address of the locality or legal entity.

Abacus Consulting has hundreds of sociodemographic variables at census section level, such as age ranges or population, among many others.

These variables will be used to define groups of stores, customers or users with similar characteristics through grouping techniques and advanced analytics.

By grouping points of interest into clusters, we will be able to make smarter decisions depending on the characteristics of the customers or users that visit each type of store or point of interest.
We conduct socio-demographic research with digital cartography using geographic information systems (GIS) to be able to encode and manage geospatial data.
By means of hexagon maps, in which all the necessary indicators have been added, we can search for market gaps.

From the search we can determine the potential and profitability of the market niche.
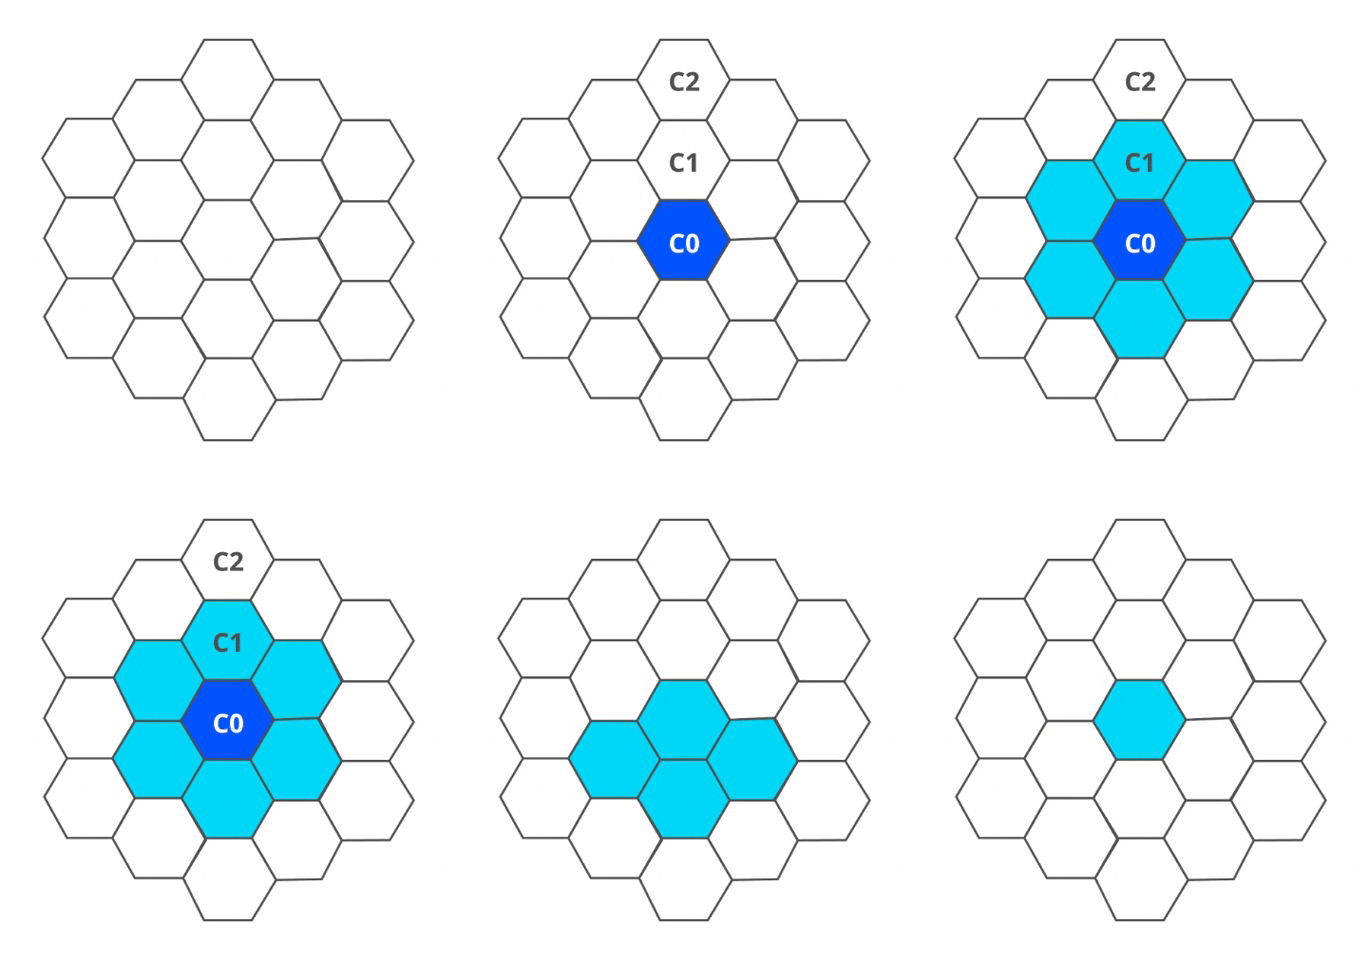
Hexagonal grid searches can be set at different distance levels or perimeters.
Our layers of analysis:

This type of maps allows thematic maps to be made to detect areas where certain conditions are met.

We use as a form of representation a thermography that establishes a two-pole hierarchy. Generally, warm heats show the zones of action or interest.
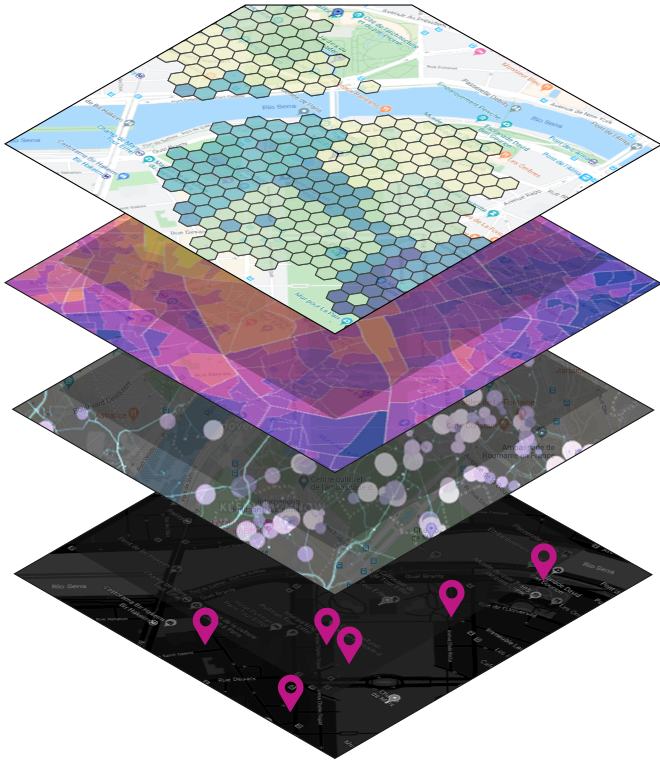

Select a shape (circle, square, triangle) and vary the size in proportion to the quantities.

We have geopositioning databases of legal and physical entities.
Abacus Consulting cuenta con una base de datos de indicadores calculada a cualquier nivel geográfico.

All types of territorial statistics aggregated at national and regional level.
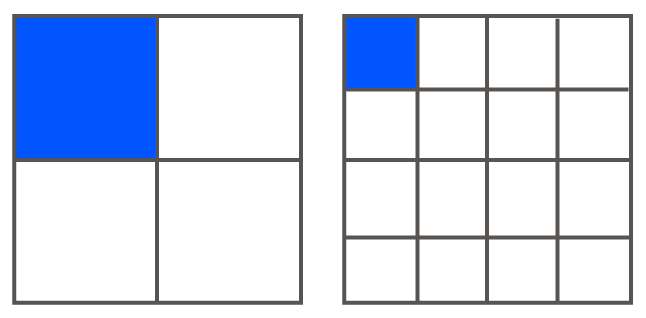
We have aggregated data at the municipality and zip code level.
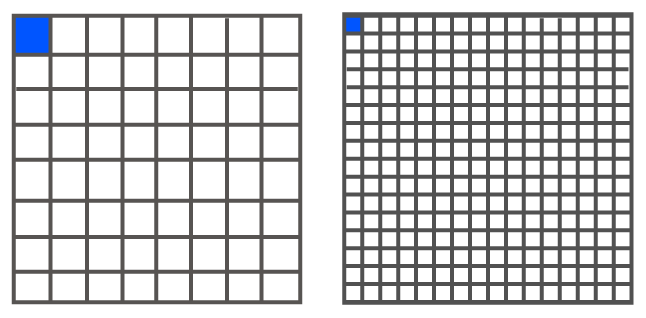
Detailed information at district, neighborhood and portal level, and aggregated by gender, age, income…


|

|

|